

Global Context
The global commodities complex is navigating acute physical and geopolitical tensions in late September 2026. Military escalation across the Persian Gulf, marked by targeted U.S. strikes against Iranian vessels and coastal launch sites in retaliation for tanker attacks near Kharg Island, maintains maritime transit through the Strait of Hormuz under a partial blockade. Daily hydrocarbon volumes navigating this critical chokepoint remain restricted to approximately 10 million barrels per day, roughly half of its baseline flow of 20 million barrels.
This upstream supply constriction extends far beyond unrefined crude prices, triggering an unprecedented global refining crisis. The inability to regularly deliver medium and heavy sour crudes to Western refining centers, compounded by the extension of Russian export bans, has fueled an explosive surge in middle distillate refining margins, propelling industrial fuel costs to historical highs. Simultaneously, the European natural gas market remains choked by disruptions to Qatari cargoes, while industrial metals undergo dramatic physical inventory distortions on financial exchanges driven by pre-tariff frontrunning.
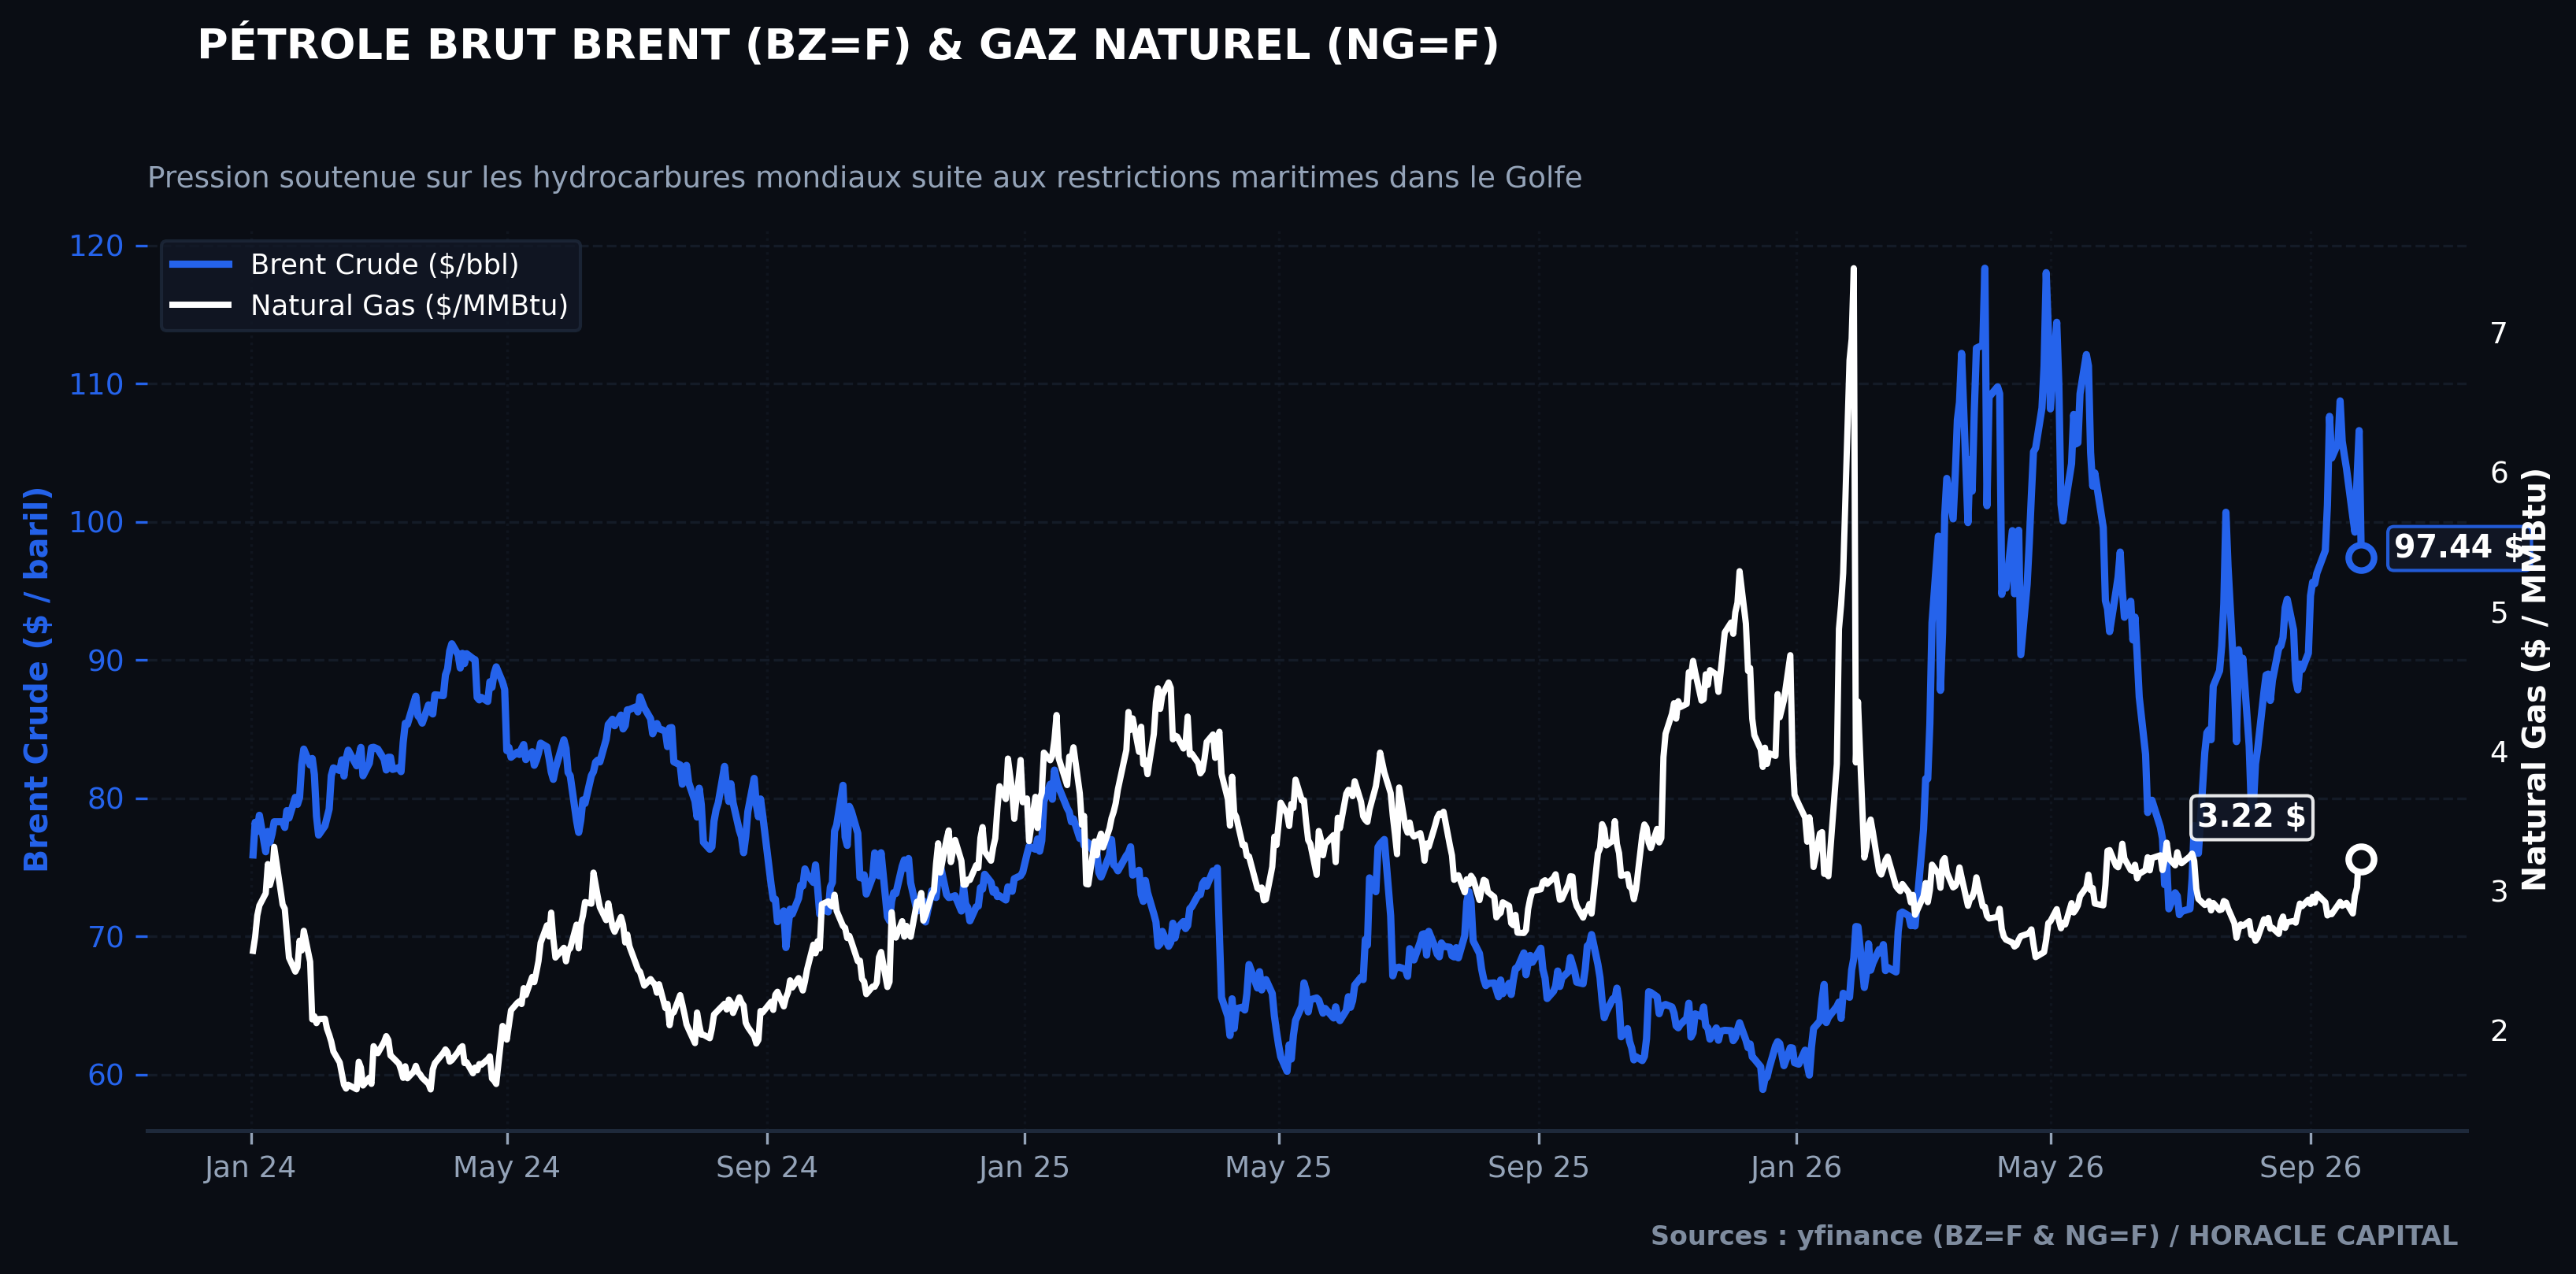
Comparative price action of Brent crude ($104.30 / bbl) and natural gas (NG=F). Sources: yfinance (BZ=F, NG=F) and FRED API (DCOILBRENTEU).
Crude Oil
Crude oil benchmarks remain firmly locked in an elevated pricing regime. North Sea Brent oscillates between $100 and $105 per barrel, settling at $104.30 at the weekly close, while West Texas Intermediate (WTI) trades around $92.40. Futures curve backwardation remains intensely steep, reflecting an immediate physical scarcity premium demanded by traders confronted with unreliable loading schedules in the Gulf.
Saudi attempts to reroute export flows via the East-West pipeline to Yanbu terminals on the Red Sea face persistent drone and missile harassment by Yemeni rebels, limiting effective throughput on this bypass corridor to less than 3 million barrels per day. On the demand side, China is absorbing this physical shock by drawing heavily on state strategic reserves. Chinese crude imports dropped to 8.88 million barrels per day in August, marking a cumulative 14.7% year-over-year contraction. While this emergency destocking shields Beijing from paying punitive spot prices in the near term, it steadily exhausts the buffer capacity of the world’s leading importer should the maritime chokepoint remain impaired beyond the fourth quarter.
Distillates & Crack Spread
The critical breaking point in the energy market is located not at the wellhead, but within the global refining complex. Average U.S. distillate crack spreads surged to an all-time record of $75 per barrel, representing a near-200% surge since February. This dislocation stems from an acute technical mismatch across the global refinery fleet: numerous cracking and hydrotreating units in Europe and the U.S. East Coast are engineered to run heavy and medium sour slates, making them unable to process elevated volumes of light sweet U.S. shale without a severe drop in middle distillate yields.
This structural rigidity is exacerbated by Moscow’s decision to extend its complete ban on diesel exports through month-end, stripping the Atlantic Basin of pivotal balancing volumes. At the same time, the Northern Hemisphere enters peak agricultural harvest season, requiring substantial off-road diesel demand, alongside the seasonal ramp-up in heating oil storage. With global middle distillate inventories hovering at multi-year lows, refining shortages feed directly into logistics networks, trucking, and rail freight, delivering a direct cost-push inflationary impulse to producer price indexes that central banks cannot ignore.
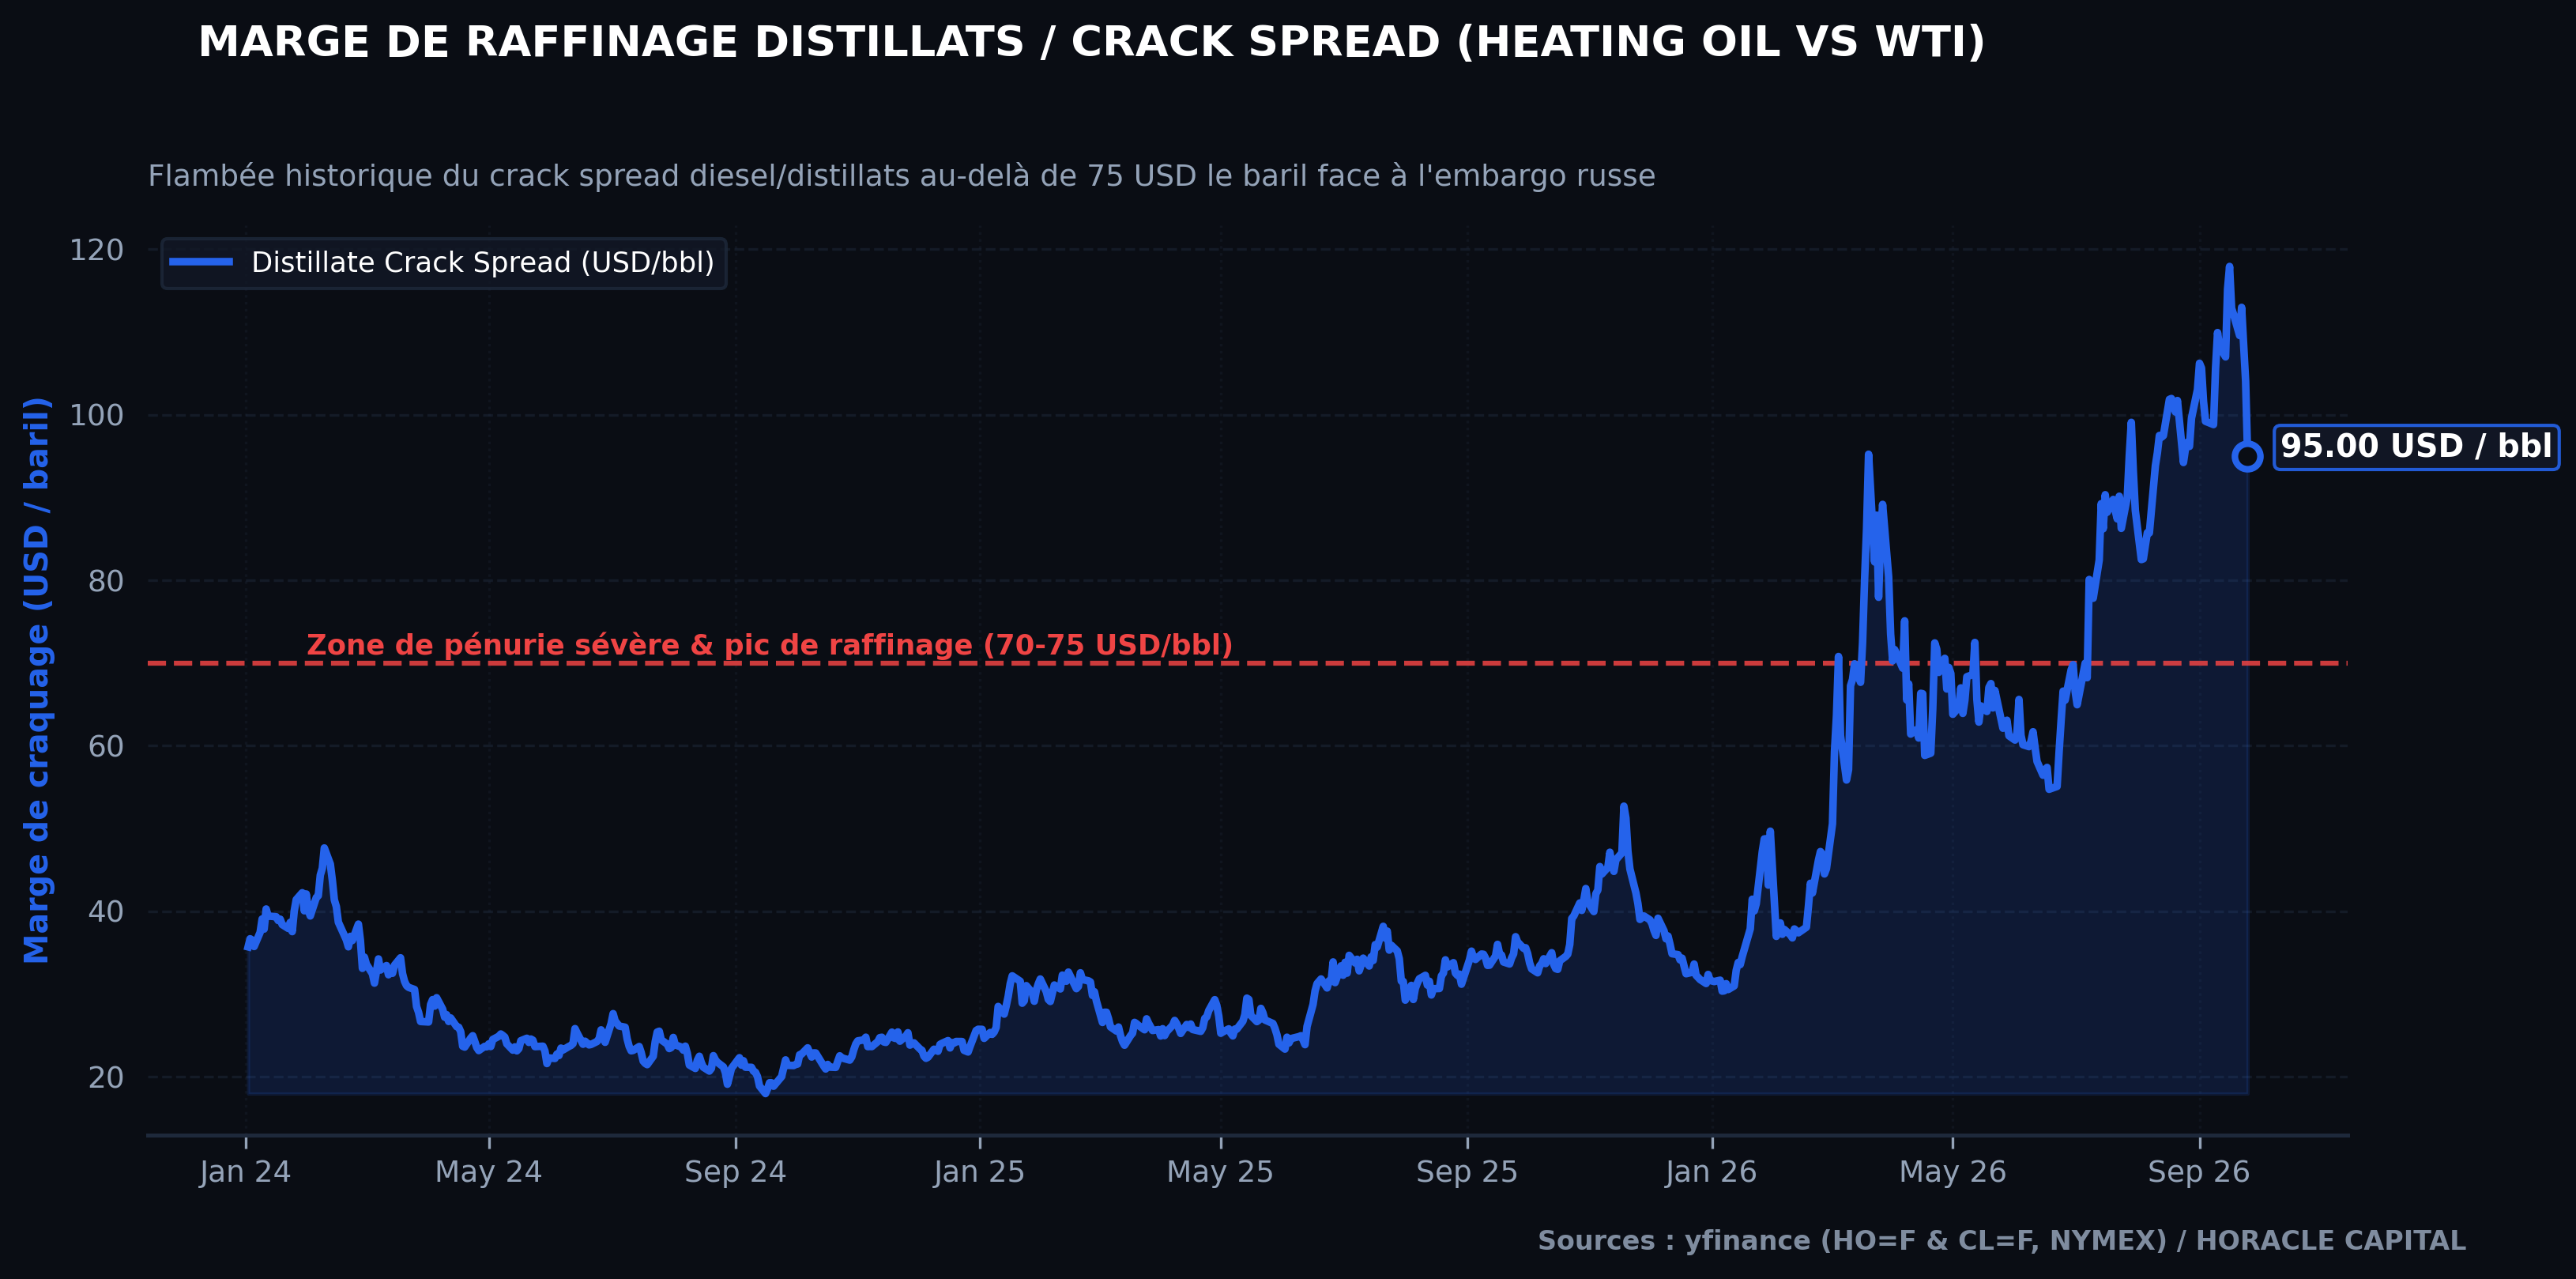
Middle distillate refining margin (Heating Oil vs WTI crack spread at $75 / bbl). Sources: yfinance (HO=F, CL=F, NYMEX).
Natural Gas
In the European gas market, the benchmark Dutch TTF front-month contract traded up to 71.89 euros per megawatt-hour, registering a 117% year-over-year surge. This vertical move stems directly from the continuation of force majeure declared by QatarEnergy across all European LNG delivery contracts following navigational disruptions in the Gulf. With LNG tankers avoiding the Strait of Hormuz amid security threats, European regasification terminals have registered a sharp slump in spot deliveries.
This bottleneck arrives at a precarious point in the seasonal storage calendar. European Union underground gas storage levels stand at just 68% of capacity, significantly lagging the mandatory 75% regulatory filling threshold mandated for October 1. This structural inventory deficit forces continental utilities to bid aggressively for available U.S. and West African LNG cargoes, escalating price competition with Asian buyers. For European industrial manufacturers, particularly German specialty chemicals and nitrogen fertilizer producers, natural gas prices north of 70 euros per megawatt-hour directly compress operating margins and accelerate the deindustrialization signals visible in private sector PMI surveys.
Copper
The copper market is witnessing extreme physical and speculative distortions on the London Metal Exchange (LME). The three-month forward contract rallied toward $14,800 per metric ton, probing the major psychological barrier at $15,000. This rally in no way reflects a resurgence in underlying end-use demand, as Asian industrial consumption remains hindered by a 7.2% contraction in Chinese fixed-asset investment and uninterrupted declines in new home prices.
The true driver of this rally is tariff frontrunning. In response to U.S. administration announcements detailing 15% tariffs on imported refined copper cathode effective January 2027, rising to 30% in 2028, international trading houses have redirected massive cathode volumes into U.S.-licensed COMEX warehouses. This physical redirection has depleted warrant-available inventories across European and Asian LME depots. Physical market participants holding short hedging positions found themselves trapped by vanishing deliverable liquidity, sparking an aggressive short squeeze that blew out nearby calendar spreads into extreme backwardation. This artificial wedge between financial pricing and physical demand leaves copper highly vulnerable to a sharp pullback if the tariff rollout timeline is modified or postponed.
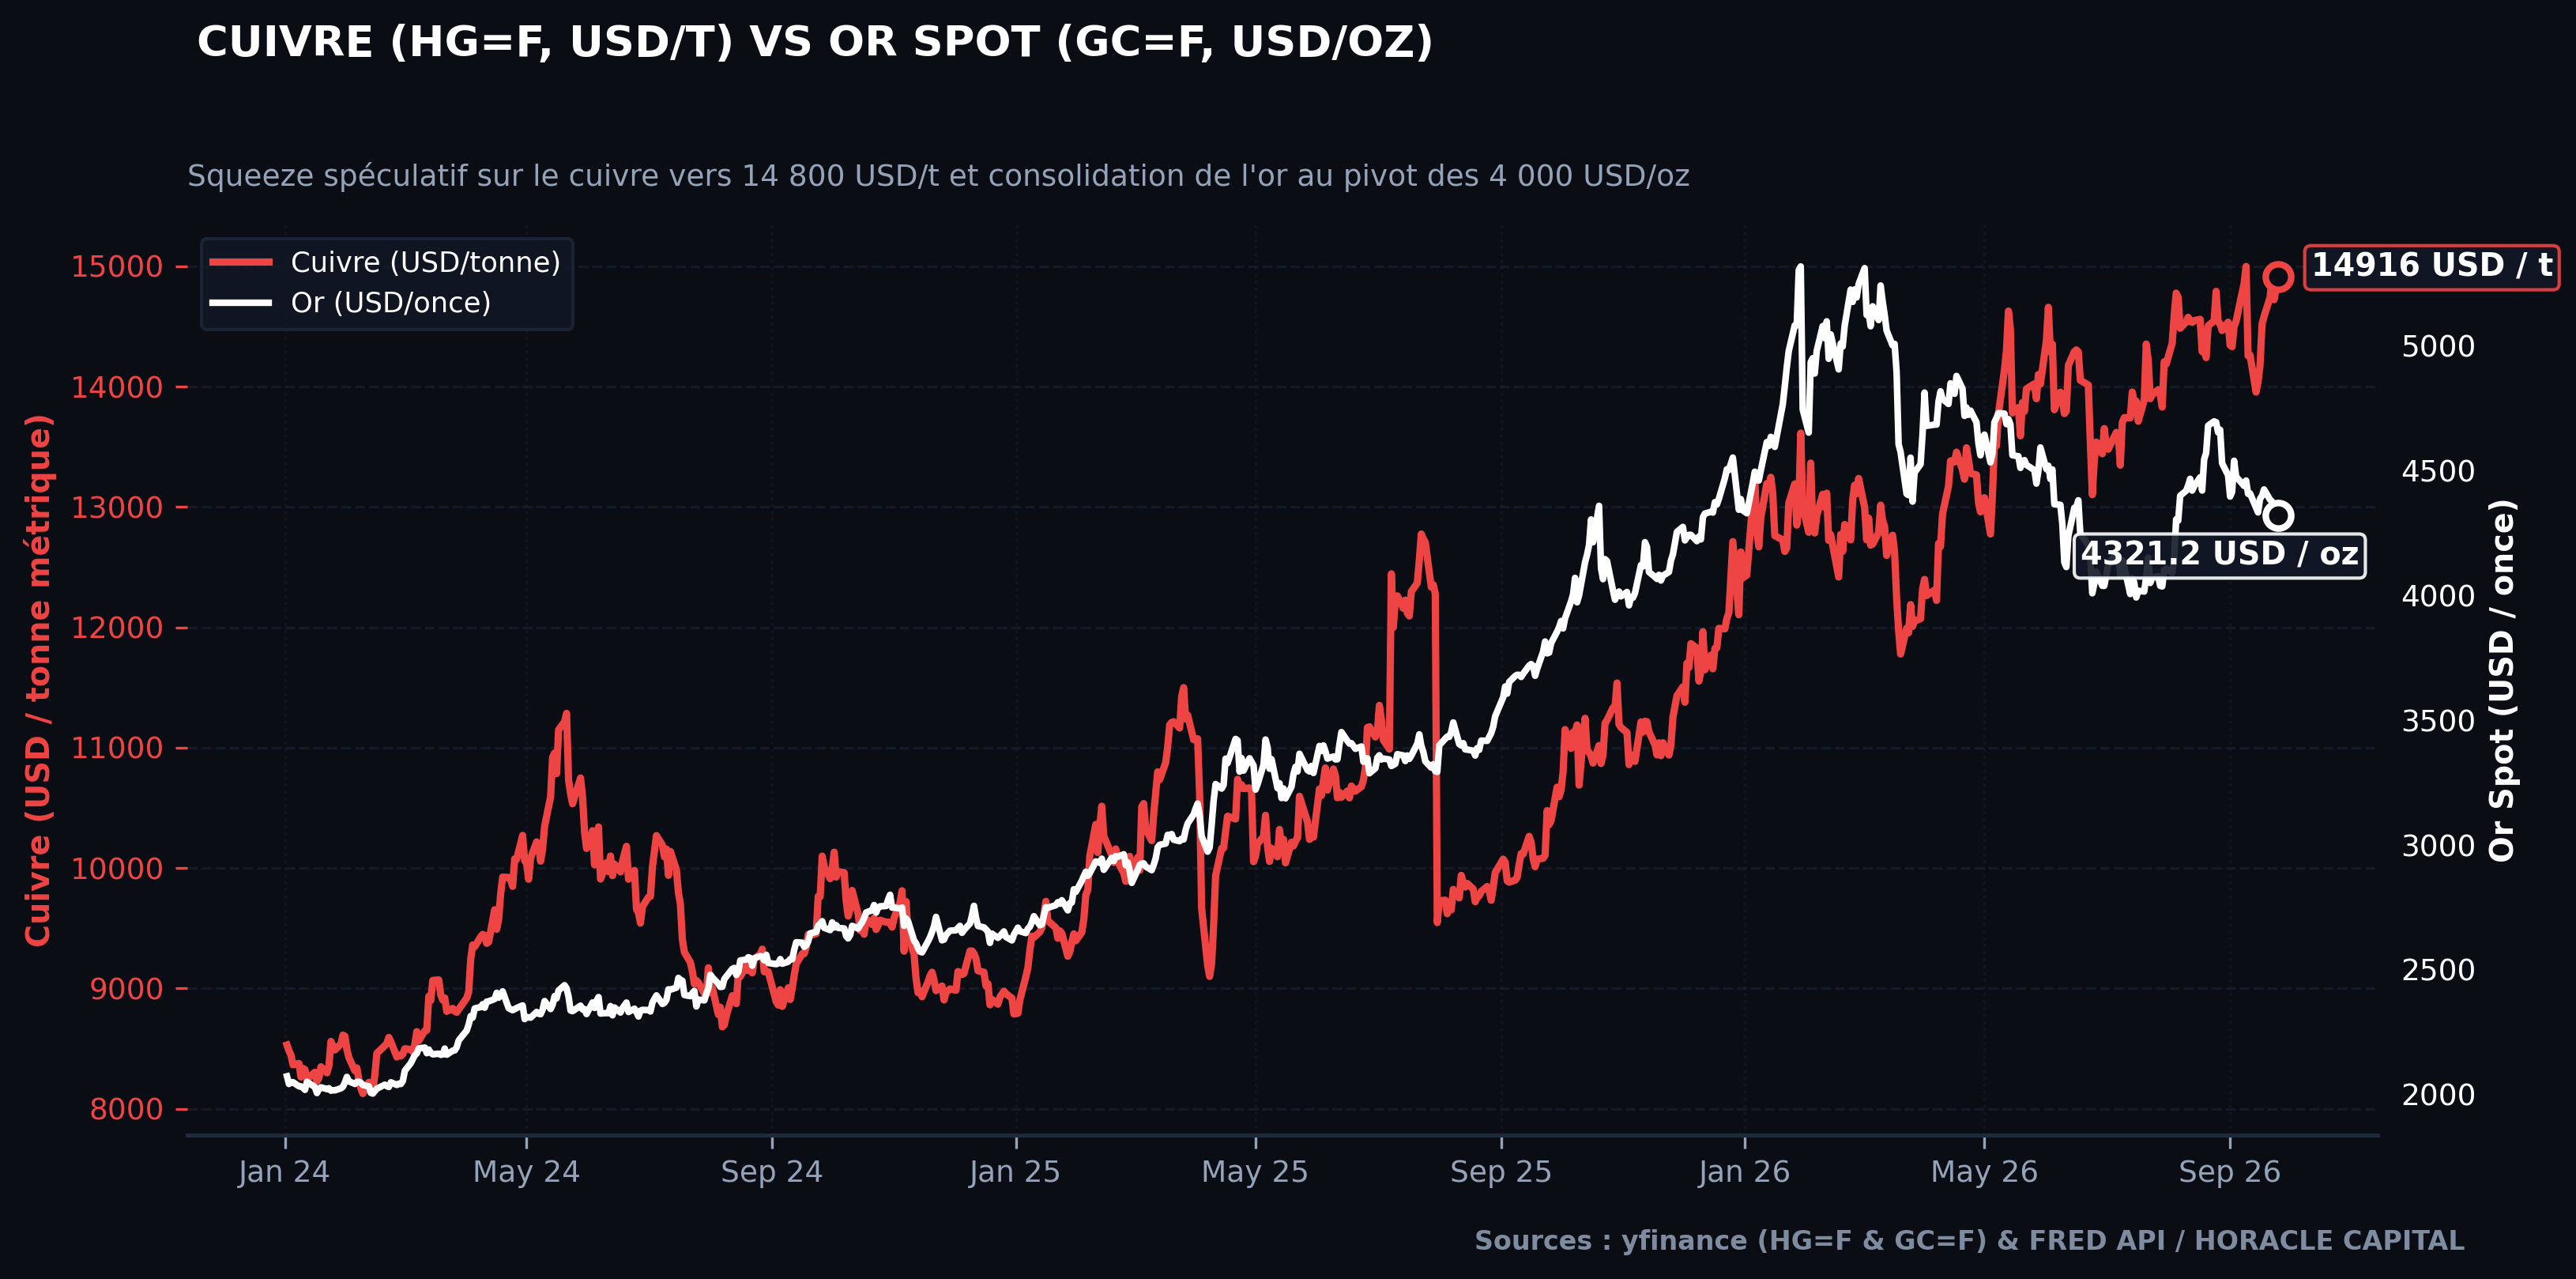
Comparative performance of copper ($14,800 / ton) and spot gold ($4,000 / oz). Sources: yfinance (HG=F, GC=F) and FRED API.
Gold
Spot gold (XAU/USD) is consolidating around the symbolic threshold of $4,000 per ounce, caught between two opposing macroeconomic forces. On one hand, bullion faces continuous downward pressure from elevated U.S. sovereign yields, with the nominal 10-year Treasury yield holding at 5.10% and the 10-year TIPS real yield above 2.55%. Sustained high opportunity costs and hawkish rhetoric from Federal Reserve Chair Kevin Warsh reaffirming a commitment to crush inflation encourage hedge funds to scale back zero-yielding duration exposure.
On the other hand, the metal enjoys persistent institutional demand that cushions every retracement. Central banks across emerging economies and the Global South maintain a steady reserve diversification program away from the dollar, absorbing an average net volume of 41 metric tons per month in physical gold. Simultaneously, widening sovereign risk spreads across continental Europe, highlighted by the French OAT-Bund spread touching 110 basis points, reinforces gold’s role as the premier hedge against monetary fragmentation and deteriorating credit quality among sovereign Western issuers.
Carbon
In the European carbon market (EU ETS), greenhouse gas allowance prices confirm a structural upward trend. Revised projections from ING research model an average price of 83 euros per metric ton in 2026, up from 75 euros in 2025. This rise is underpinned by regulatory supply tightening across the European Union, including full inclusion of maritime shipping emissions (100% compliance coverage starting early next year) and the phaseout of free allowance allocations to commercial airlines.
This quantitative squeeze is amplified by ongoing allowance cancellations via the Market Stability Reserve (MSR) and the operational rollout of the Carbon Border Adjustment Mechanism (CBAM). Although European manufacturing federations in steel, chemicals, and cement continue to lobby for implementation delays given already punitive electricity costs, the European Commission is sticking to its decarbonization timeline. This regulatory supply shrinkage cements carbon allowances as an inelastic input cost, prompting energy-intensive corporates to secure multi-year compliance hedges at current market levels.
Conclusion
Cross-asset analysis in the commodities space reveals a clear divergence between assets experiencing physical refining scarcity and those driven by transient tariff frontrunning. In energy, holding refining margins offers the most asymmetric risk/reward: maintaining long exposure to heating oil and diesel crack spreads against WTI crude captures the physical distillate bottleneck without taking binary directional risk on military developments in the Strait of Hormuz.
In base metals, LME copper’s move toward $14,800 per ton exhibits clear signs of a technical squeeze decoupled from weak underlying Chinese industrial consumption, offering an attractive contrarian short opportunity targeting $13,200 to $13,500 once inventory flows to COMEX normalize. Finally, gold remains a core strategic reserve allocation, to be accumulated on dips toward the $3,980 to $4,000 zone as insurance against European fiscal fragmentation.
Cette analyse a-t-elle été utile à votre allocation ?
Attribuez une note de 1 à 5 étoiles (réservé aux membres Horacle Capital).

Léo Lombardini
Trader, Economics & Quant
Passionate about market analysis and statistical modeling, Léo oversees the strategic allocation of the model portfolio and the development of Horacle Capital's quantitative frameworks, as well as writing weekly articles.
Learn more about the author →Go further with our models
Get the weekly biases of our models by email, or open the full platform.